3 Transfers Replication: Population Estimates and FPM Coefficients
3.1 Overview
While constructing the data, I noticed a flaw in the original paper’s methodology, which led me to want to investigate further. The original paper’s population estimates are prone to after-the-fact corrections, while my methodology leverages population estimates used in practice to estimate the transfers. In this section, I compare our and their estimates to determine if there are any substantive differences and find that there are some differences in population estimates around the FPM cut-offs, though I cannot clearly conclude this is the sole or even a major issue for the replication.
The population estimates are used to compute the theoretical FPM coefficients. In this section I compare both our theoretical and actual FPM coefficients to theirs and notice that their data contains multiple, incorrect missing observations. While it is not entirely clear where and how their FPM data was cleaned, the cleaning process for my data was straightforward and took information from the original FPM transfer documentation. Furthermore, I detected an issue in how they compute the theoretical ‘reductor’ (\(\alpha\)) for the theoretical FPM coefficients for special cases. Since the theoretical FPM transfers are computed as a share of the total final coefficients, this issue may be a relevant issue for the whole paper. Lastly, we observe 1-2%s differences in the actual vs prescribed transfers in BRL for several states using our data. These differences may be relevant given the small size of municipalities in the interior FPM category.
3.2 Population Estimates
In terms of inputs The population data I created is taken from the IBGE population estimates contained within the original material used to compute the FPM coefficients and estimates. Their population data is taken from IBGE directly. Since we only read in and clean population estimates for municipalities classified as interior, our data ought to be a subset of their data. Empirically, this turns out to be the case; all of the municipalities in our data are contained within theirs. The inverse is not true; their population input data includes more municipalities than needed. To test whether we are missing any municipality-years which is included in their data, we subset their data to municipalities not in our data-set and with a population below 50,941; i.e. the FPM cut-off which separates “interior municipalities” (relevant to the paper) from “reserve municipalities”. Fernando de Noronha (municipio == 260545) is the only municipality which meets these requirements, but given the island’s legal status in Brazil, it does not fall within our sample either.

3.3 FPM Coefficients
3.3.1 Actual FPM transfers
There are a number of variables at play with the FPM transfers, which lead to significant differences across theoretical and actual allocation quotas.
3.3.1.1 Actual FPM by input data-set: Comparison
We compare actual FPM transfers across both their input and our input data-set, for the years between and including 2002-2014 and population brackets below 50,941. Despite there being no municipalities in their data-set which our data-set does not contain, our data-set includes three additional municipalities not found in theirs. These are: “Itapuã do Oeste, RO” (municipio==110110), “Pinto Bandeira, RS” (municipio==431454), and “Queluzito, MG” (municipio==315380) and are relatively minor municipalities, both generally and as a share of interior FPM transfers. While “Itapuã do Oeste, RO” receives 1% of the state-wide FPM transfers dedicated to interior municipalities, the other two receive a fraction of a percent from their states. This will lead to slightly different theoretical FPM transfers between our data-sets.
3.3.1.1.1 Missing data for actual FPM transfers
Between 2002-2014, there are no municipality-years in their data which is not in ours. There are, however, 3 unique municipalities which are missing in their data. There municipalities are: 110110, 431454 and 315380. While the latter two are missing for a few years, 110110 is missing for all years.
3.3.1.1.2 Correlation of Actual FPM transfers
We test whether there are any differences across the actual FPM transfer variables. We do so by computing the correlation between their and our variables, using our full sample (given that our data contains all of the correct municipality-years). When excluding the missing municipality-years in their data, we get a perfect correlation of 1 between their and our actual FPM transfers in nominal BRL. When including missing observations from their data-set and labeling them as 0s, the correlation dips slightly to 0.9999638.
3.3.2 Theoretical FPM Transfers
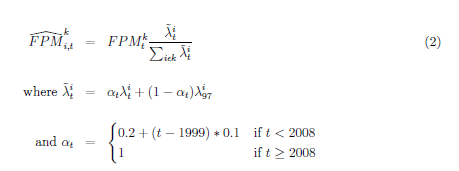
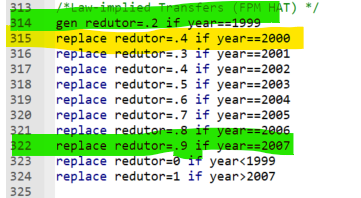
The authors compute theoretical FPM coefficients incorrectly in part due to their methodology, which is prone to errors, coding and data inconsistencies. Fundamentally, their approach is to take the actual FPM transfers, compute each municipality-year coefficient and it’s state share of transfers and apply it to the state lump sum. This approach is not incorrect, but requires that all coefficients are correctly computed, which is not the case. Their data-set contains significant amounts of missing data for municipalities affected by the 1999 ruling, which leads to incorrect hypothetical coefficients and, since allocation is defined as a share, leads to inconsistencies in general theoretical allocations. Additionally, there are a few instances where actual FPM transfers are missing for some municipality-years. Lastly, in the code, the authors assigned the following FPM ‘redutor’ (\(\alpha_t\)): 0.2,
3.3.2.1 Missing data for 1997 coefficient
An additional concern with their data was the large number of missing 1997 coefficients. This impacts the calculation of the updated FPM coefficient for special municipalities, which were given fiscal leniency between 1999 and 2007. When we clean the FPM coefficient data-sets, we take note of the special cases explicitly. This allows us to easily test whether they correctly kept
Correlation of 1997 coefficient for special cases
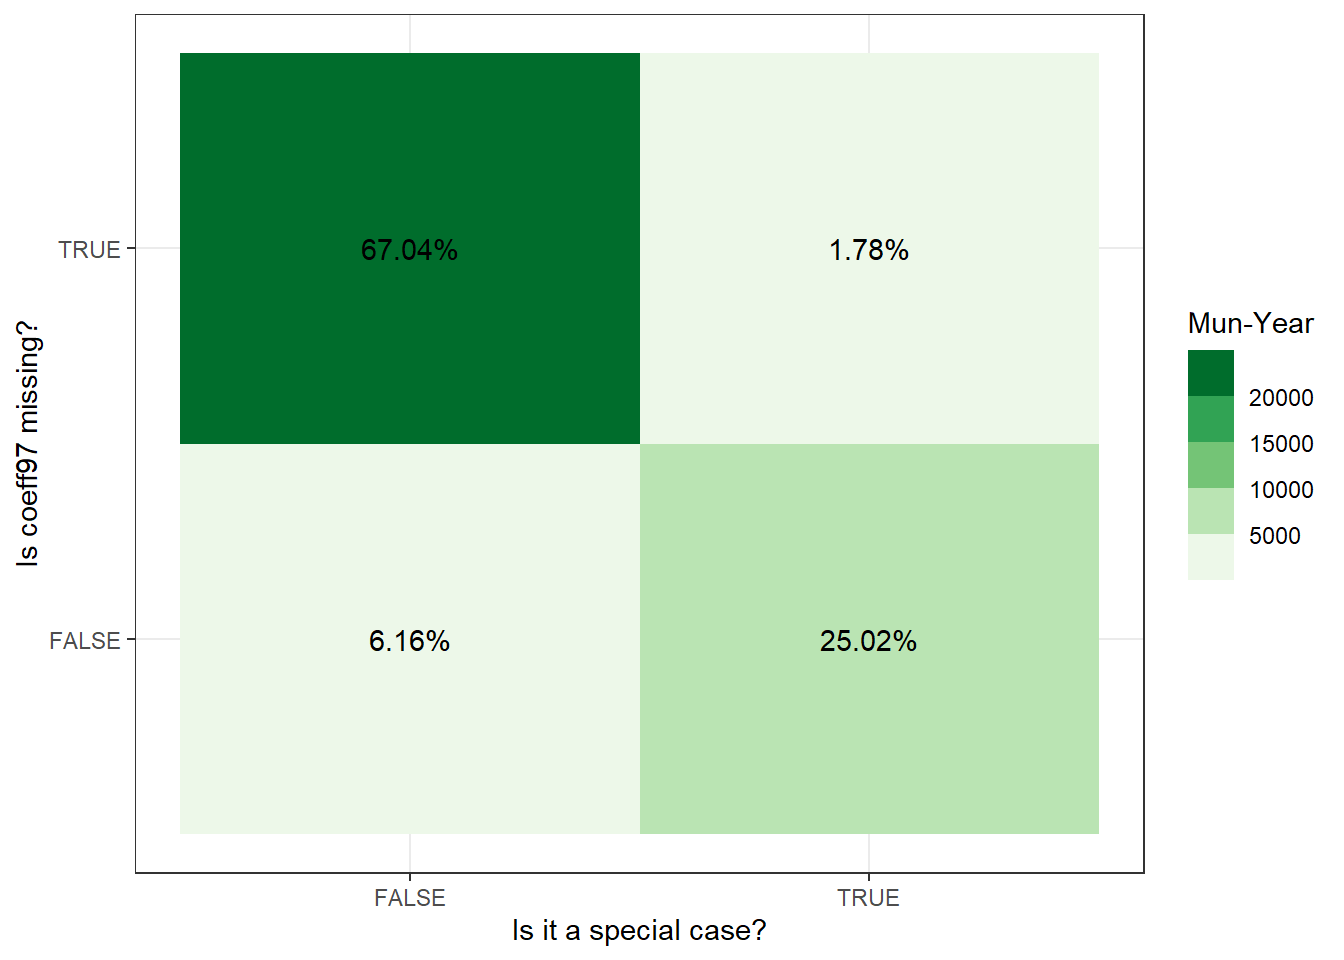
This table compares the 1997 population-based FPM coefficient for municipality-years in the full sample of municipality-years. We keep observations for all municipality-years available in the files we cleaned, which correspond to municipality-years which follow the small city “Interior” FPM rules. Given the few minor differences between our sample and their sample, we further restrict the sample to only include municipality-years in both samples. We only consider years between 2002-2007 (inclusive), which is when these edge cases occur. As the authors do in the original data, we substitute missing observatios with 0s. The high yet imperfect correlation coefficients indicate issues with their computations of theoretical FPM coefficients. Corr.x represents the correlation between 1997 coefficients when subsituting missing data with 0. Corr.y represents the correlation when removing rows from their 1997 FPM variable with missing data.
This begs the question, are the missing 1997 observations all related to observations which are not special cases? Below, we plot a figure which indicates that being a special case does not preclude the 1997 coefficient from being 0.

3.3.2.1.1 Which municipalities-years are affected?
All of the instances where they do not include the correct coefficients for special cases.
This table presents information on all of the special cases where a municipality-year is legally granted an exception in terms of FPM coefficients, but where they have missing 1997 FPM coefficient data for. Missing data in this category leades to incorrect specific municipality-year coefficient calculations and, more importantly, incorrect state-wide allocaiton computation.
Manaquiri, municipio == 130255 is the first observation which appears as having missing 1997 population coefficients. Upon double checking in the documentation, it is evident that this municipality is a special case (indicated by the asterisk) and will receive an alternate FPM coefficient rather than that prescribed by it’s population in 2001. As it is coded, the original paper does not take this into account.
 {#fig-cap: Image of 2002 FPM targets pdf (created in 2001) indicating a special case width=305}
 {#fig-cap: Image of 2002 FPM targets pdf (created in 2001) indicating meaning of asterisk. width=335}
3.3.2.2 Inconsistent redutor
Beyond not having a methodology which correctly accounts for inconsistencies in the data, the authors include an FPM computation rule which is either mis-specified in the code or in the paper.
 {#fig-cap: Image of theoretical coefficient and redutor from Appendix A. width=230}
 {#fig-cap: Image of redutor as it is coded in the paper width=180}

3.3.3 Perscribed FPM transfers vs Actual Transfers
Given these inconsistencies shown above, the best course of action is to move forward by making adjustments to their approach. This involves, first, taking a data-first approach, where we discard their allocation model and only use data from sources are they appear.
Our data contains several statistics which we use to compute multiple versions of the theoretical FPM transfers. First, between 2004-2019, we have data on the defacto percentage of a state’s total yearly FPM transfers destined to a specific municipality. These are included in the previous year’s FPM report. We can use this to track whether the actual FPM transfers in year \(t\) match the prescribed percentage specified in the year \(t-1\) federal budget report. To perform this analysis, we use a municipality-year’s actual FPM transfer in nominal BRL, we sum all of these actual transfers for all municipalities that receive the interior FPM transfer and divide the municipal FPM transfer by the the state`s total amount. Inconsistencies here point to either missing municipalities in our data or an actual disconnect between the prescribed amounts and what is actually sent.

uf equal “RO”, and even there, it was clear that differences amount to rounding errors.Adding FPM percentages by state - year. Comparing actual from perscribed transfer percentages.

s states total FPM transfer – and the actual share of state funds destined to interior muncipalities that were actually given to each interior municipality. The majority of municipality-years recieves the perscribed percentage, as seen by the 45 degree line traced in the data. A significant minority of municipalities however, are given larger than expected shares. These municipalities are invariably small (within the state), as seen by their low perscribed share of funds. These municipality-years are clustered across several states.Perscribed vs Actual transfers by State (uf)

s states total FPM transfer – and the actual share of state funds destined to interior muncipalities that were actually given to each interior municipality. The majority of municipality-years recieves the perscribed percentage, as seen by the 45 degree line traced in the data. A significant minority of municipalities however, are given larger than expected shares. These municipalities are invariably small (within the state), as seen by their low perscribed share of funds. These municipality-years appear to have no temporal relationship.Perscribed vs Actual transfers by Year

s states total FPM transfer – and the actual share of state funds destined to interior muncipalities that were actually given to each interior municipality. The majority of municipality-years recieves the perscribed percentage, as seen by the 45 degree line traced in the data. A significant minority of municipalities however, are given larger than expected shares. These municipalities are invariably small (within the state), as seen by their low perscribed share of funds. Whether a municipality is afforded special priviledges or not does not appear to be associated with these differences.Perscribed vs Actual transfers by Special cases

s states total FPM transfer – and the actual share of state funds destined to interior muncipalities that were actually given to each interior municipality. Here we divide the actual transfer by the perscribed transfers. The majority of municipality-years recieves the perscribed percentage, as seen by the 45 degree line traced in the data. A significant minority of municipalities however, are given larger than expected shares. These municipalities are invariably small (within the state), as seen by their low perscribed share of funds. Whether a municipality is afforded special priviledges or not does not appear to be associated with these differences.Actual over Perscribed


Regressing Actual FPM State Share on Perscribed FPM State Share + Controls
Output illustrates that the correlation between perscribed and actual transfers is very high, therefore, minor differences ought not to be taken into consideration.
?(caption)


